-
 Michael Maassel
0Good day.
Michael Maassel
0Good day.
I am a professor and I am looking for some help in showing my students the relationship between time domain and frequency domain.
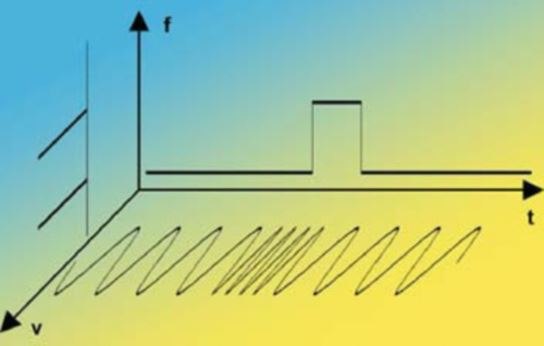
I plan on starting with just a sinewave to show them the time domain response and then the frequency domain response on the same graph. Currently, I just draw the graph by hand and it does provide some insight for my students. However, I was hoping to be able to do more complex waveforms (AM and FM signals).
Here is an image of what I am attempting to do.
I have access to ADS (by Keysight), LTSpice, and Matlab.
Thank you
Michael -
 madengr
1I’d think you’d need to write something in Matlab or Python to get the 3D orthogonal view like that.
madengr
1I’d think you’d need to write something in Matlab or Python to get the 3D orthogonal view like that.
Have a look a Baudline. It does sliding FFT analysis, and you can have the time domain displayed with the spectrogram. You can slide the window along in the time domain and see the spectrum change. You can also pipe it signals from GNU Radio via a FIFO to run in real-time.
https://www.baudline.com/
GNU radio would also work as you can plot time domain (with triggering), spectrum, and waterfall.
AWR VSS will also run in real-time (continuous) and you can move tuners to change signal properties.
There is a open source copy of Baudline called Inspectrum, but it is not as fancy.


Welcome!
Join the international conversation on a broad range of microwave and RF topics. Learn about the latest developments in our industry, post questions for your peers to answer, and weigh in with some answers if you can!
Categories
- About Our Site
- Antennas
- Applications
- Biological Effects and Applications
- Calculators
- Communications
- Computer Aided Design
- EDA Software
- Emerging Applications and Technology
- Employment
- Field Theory
- Filters and Passives
- General Questions
- High Power
- History
- MMIC and RFIC
- Packaging and Materials
- Radar
- Sources and Receivers
- Test and Measurement
More Discussions
- Terms of Service
- Useful Hints and Tips
- Sign In
- © 2026 Microwaves 101 Discussion Board